In the thrilling world of Australian Football League (AFL), predicting match outcomes is as challenging as it is exciting. With home teams winning about 56% of the time, I set out to see if we could beat this baseline using the power of data science. Using Google BigQuery and machine learning techniques, I embarked on a journey to uncover hidden patterns in AFL match statistics and create a predictive model that could give us an edge in forecasting results.

See Github for all SQL code.
Dataset
For this project, I used a comprehensive Kaggle dataset containing AFL match statistics. This dataset is continuously updated and consists of three main files:
- Games: This file contains information about each match, including home and away teams, weather conditions, round number, and all scores.
- Players: This file provides details about the players, such as their positions, age, height, and weight.
- Stats: This file contains detailed player-level statistics for each match, including both offensive and defensive metrics. It covers various performance indicators such as disposals, goals, marks, Inside50s, and numerous defensive statistics.
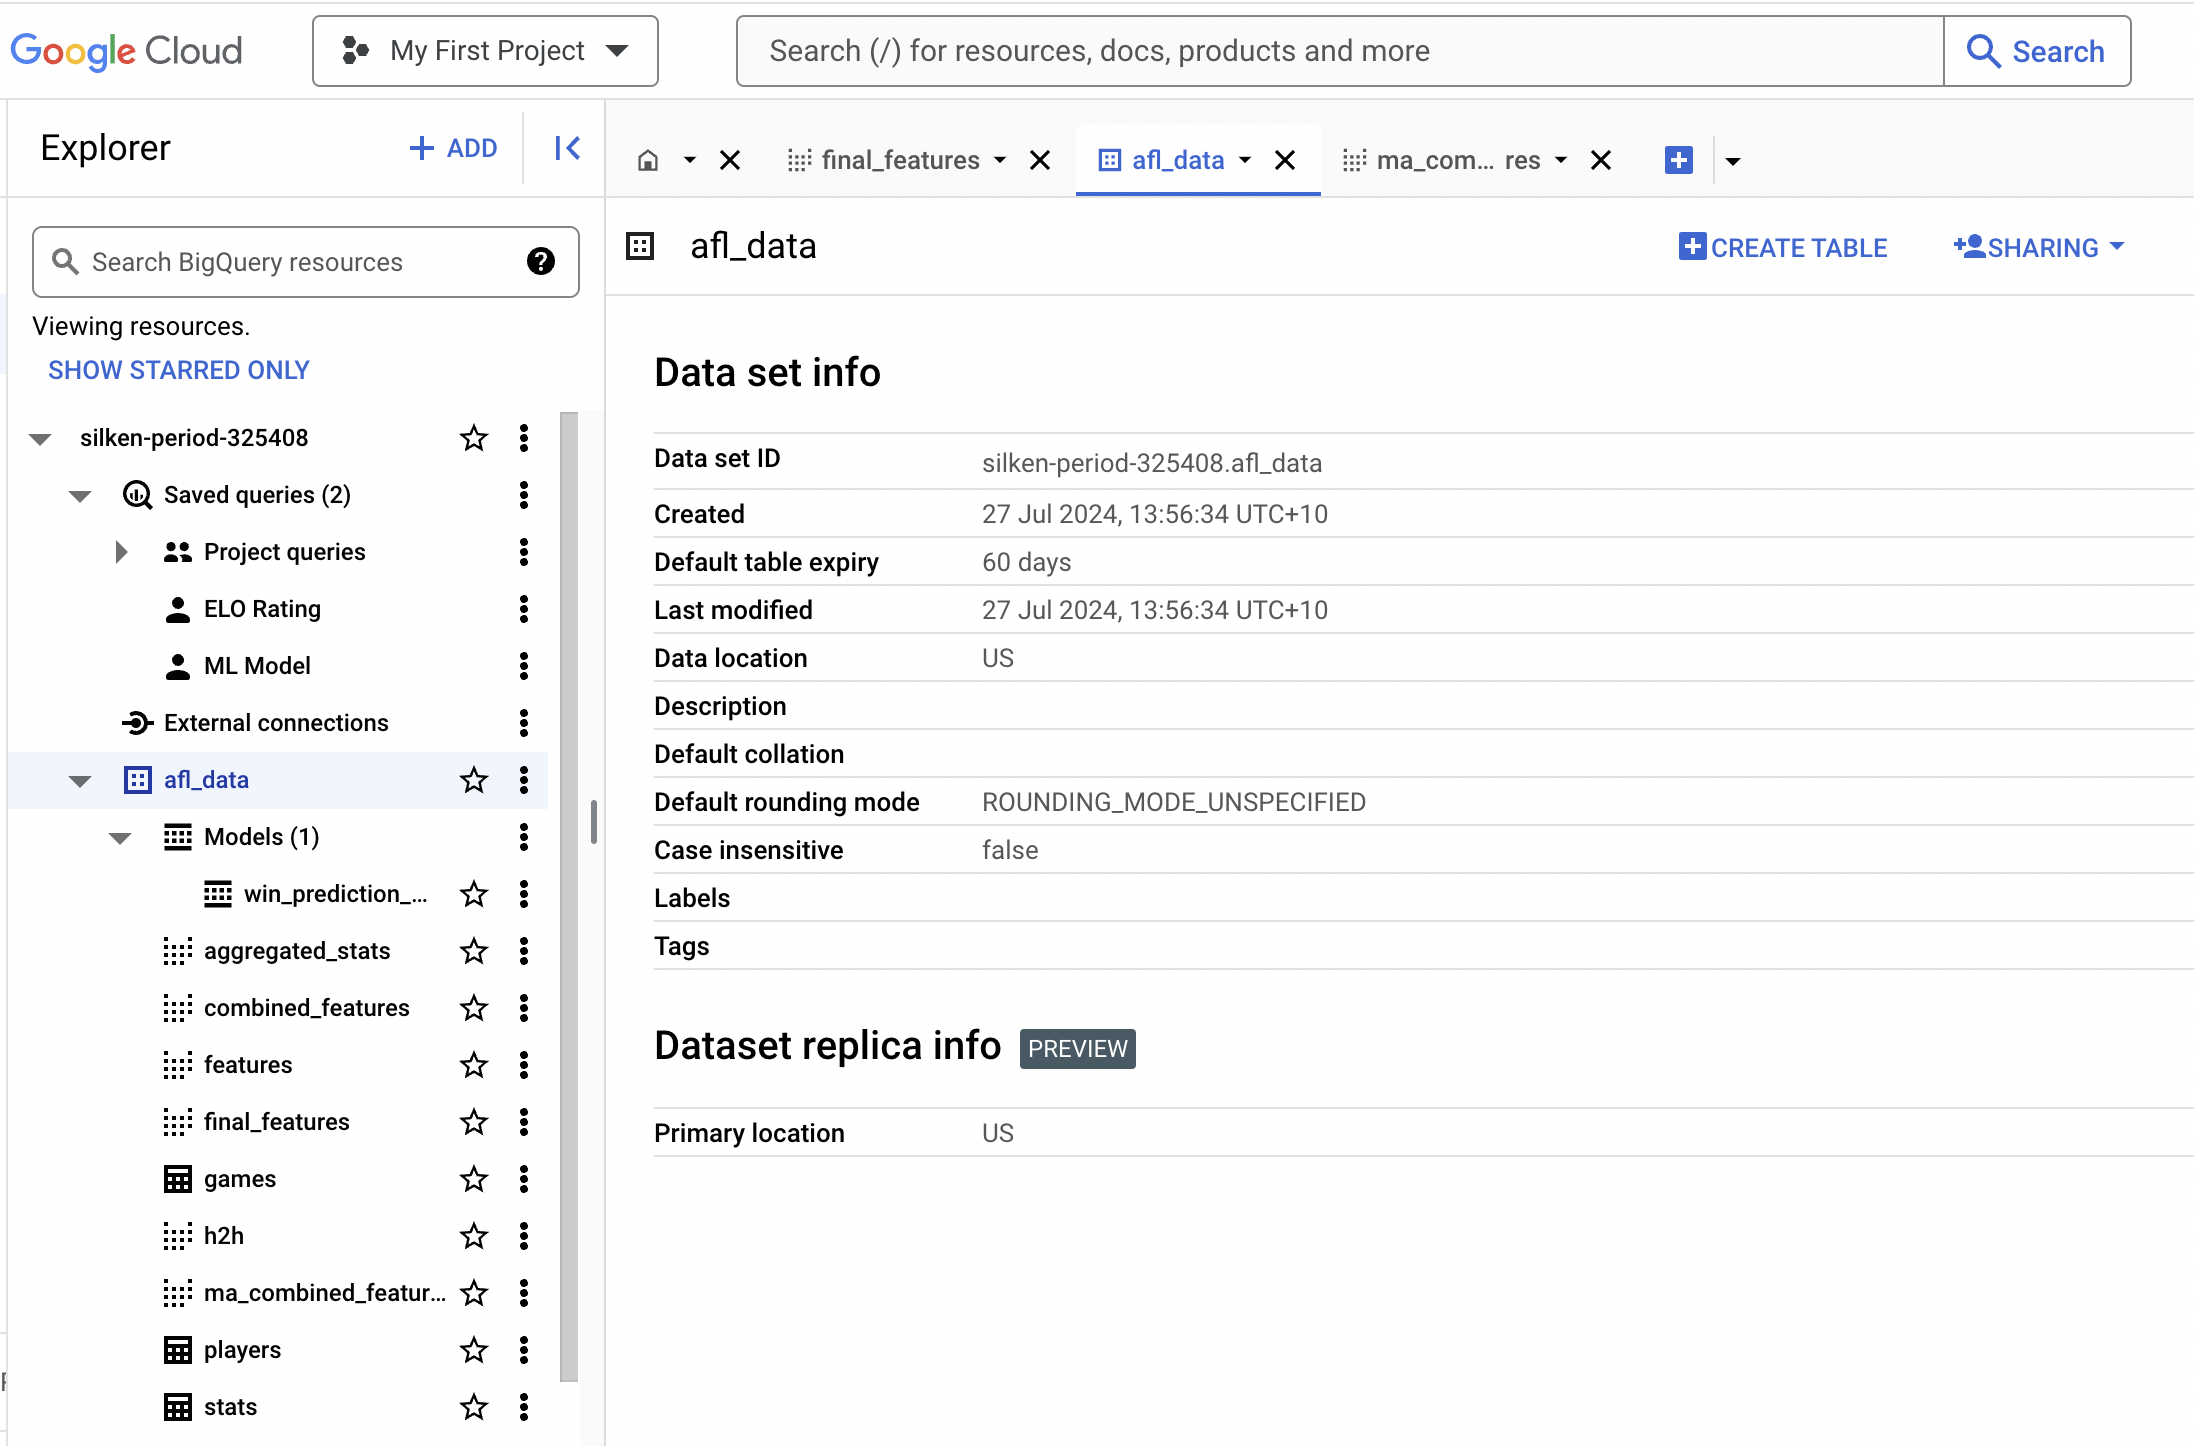
The 3 CSV files were uploaded to a BigQuery sandbox environment, enabling comprehensive analysis and the development of predictive models for match outcomes.
Preprocessing
Data preparation involved several key steps:
-
Team Statistics Aggregation: Individual player statistics, while valuable, don’t provide a complete picture of team performance. By aggregating these stats to the team level, we create a more holistic view of each team’s performance in a match.
-
Margin Calculation: The margin (difference in scores) allows our model to learn not just who wins, but by how much, potentially capturing valuable information about team strength.
-
Weather Data Imputation: Weather conditions can significantly impact game play in outdoor sports like AFL. However, missing weather data could lead to biased or incomplete analysis. By imputing missing values with averages, we ensure that all matches have weather information, allowing our model to account for these important external factors without losing data points.
-
Home/Away Game Splitting: Home field advantage is a well-documented phenomenon in sports. By separating home and away team statistics, we allow our model to learn the different patterns associated with playing at home versus away. This can capture subtle differences in team performance based on their venue.
EDA/Visualization
BigQuery’s seamless integration with Looker Studio allowed for easy and insightful data visualisation:

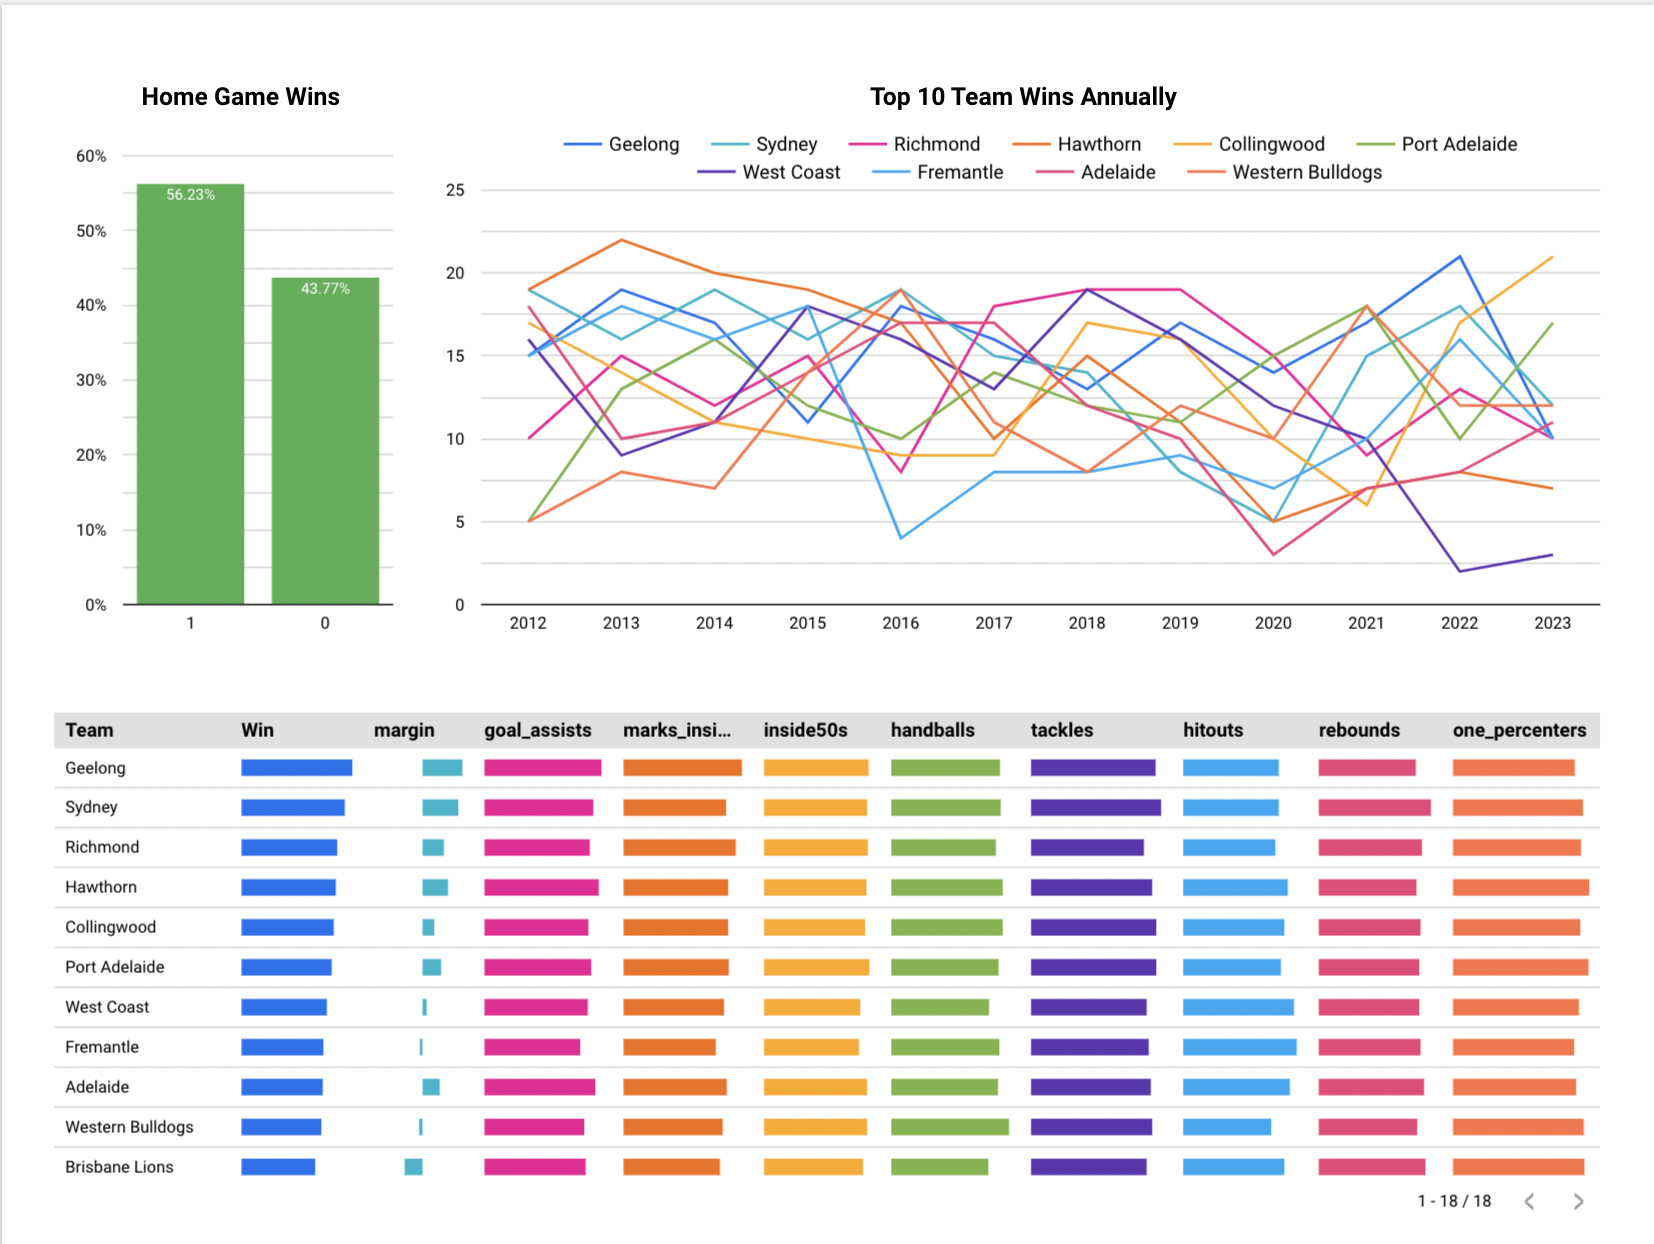
- Confirmed the 56% home win rate, establishing our baseline for prediction improvement.
- Correlation analysis revealed that offensive metrics had a stronger relationship with the target variable, justifying the need for time series techniques to capture team form.
- Visualising win distributions across years for top teams showed a fairly even spread, indicating the league’s competitiveness and the challenge in predicting outcomes.
Feature Engineering
I leveraged BigQuery’s advanced features to create rich predictors:
-
Time Series Features: Team performance often follows trends and patterns over time. By calculating rolling averages and trends for key statistics, we provide our model with information about a team’s recent form. This can be more predictive than season-long averages, as it captures current performance levels and momentum.
-
Head-to-Head Records: Some teams consistently perform well against certain opponents, regardless of overall standings. By including historical head-to-head performance, we allow our model to capture these specific team matchup dynamics that might not be evident from overall statistics alone.
-
Rest Days: The number of days since a team’s last match can impact their performance. Teams with more rest might be fresher and perform better, while teams playing on short rest might be fatigued. This feature allows our model to account for the potential impact of scheduling on team performance.
-
Round or Playoff: Teams often perform differently in regular season matches compared to high-stakes playoff games. By distinguishing between these types of matches, we allow our model to learn potentially different patterns of play or performance levels associated with regular season versus playoff contexts.
ML Model
BigQuery ML allowed for creating, analysing, and predicting models directly within the data warehouse:
-
Developed a logistic regression using all engineered features on a training set featuring 80% of data, split sequentially.
-
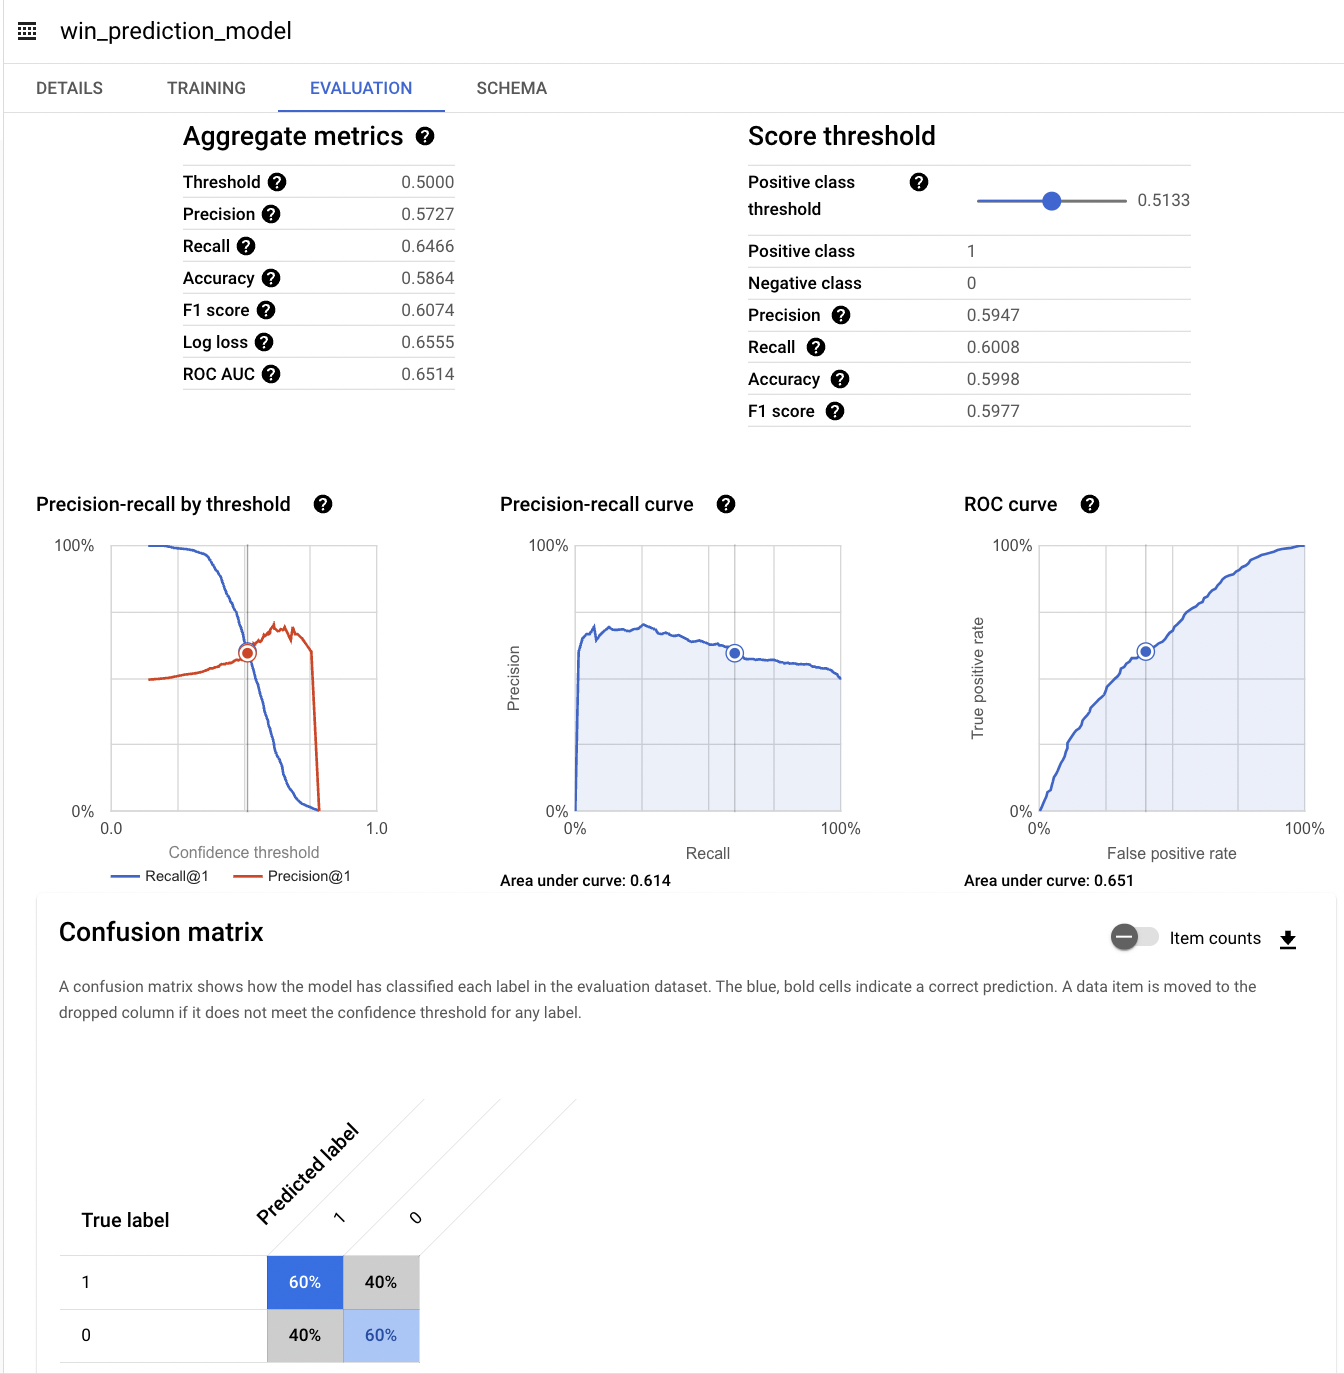
The model achieved around 65% AUC, a modest improvement over the baseline.
-
Utilized BigQuery ML’s evaluation functions to assess model performance and find the optimal classification threshold.
-
By adjusting the classification threshold to 51.33%, achieved a balanced precision and recall of 60%.

Conclusion
While the model’s performance was only slightly better than the baseline home win rate, this project demonstrated the power of BigQuery for end-to-end machine learning workflows. The fair distribution of wins among top teams and the inherent unpredictability of sports contribute to the challenge of accurate prediction.
Future improvements could include:
- Incorporating player lineup and injury data
- Successfully implementing Elo ratings (perhaps using a different approach to avoid recursion limits)
- Exploring more advanced ML techniques like LSTM networks to better capture temporal dependencies
This project showcases the potential of BigQuery for sports analytics, offering a scalable and efficient platform for data processing, feature engineering, and machine learning model development.
While we may not have cracked the code for perfect AFL predictions, we’ve certainly gained valuable insights into the complexities of the sport and the power of data-driven analysis.