The World Bank API provides access to a wealth of data on global development indicators, making it an invaluable resource for understanding a country’s profile over time. Each indicator is available through a different endpoint and is updated annually, requiring an efficient approach to gather and combine this data into a comprehensive country profile dataset. I aimed to construct a robust dataset containing various World Bank indicators for multiple countries, leveraging Azure Data Factory (ADF) and Azure Synapse Analytics. The indicators used in this project include:
- Population and Demographic Indicators:
- Total Population (SP.POP.TOTL)
- Female Population (SP.POP.TOTL.FE.IN)
- Male Population (SP.POP.TOTL.MA.IN)
- Birth Rate (SP.DYN.CBRT.IN)
- Death Rate (SP.DYN.CDRT.IN)
- Education and Employment Indicators:
- School Enrollment Duration (SE.COM.DURS)
- Industry Employment (% of total) (SL.IND.EMPL.ZS)
- Agriculture Employment (% of total) (SL.AGR.EMPL.ZS)
- Female Employment in Agriculture (% of female employment) (SL.AGR.EMPL.FE.ZS)
- Female Employment in Industry (% of female employment) (SL.IND.EMPL.FE.ZS)
- Unemployment Rate (SL.UEM.TOTL.ZS)
- Economic Indicators:
- GDP (current US$) (NY.GDP.MKTP.CD)
- Net National Income Growth Rate (NY.ADJ.NNTY.PC.KD.ZG)
- Net Financial Account (NY.GSR.NFCY.CD)
- Agricultural GDP (NV.AGR.TOTL.CD)
- Energy Indicators:
- Electricity Consumption (kWh per capita) (EG.USE.ELEC.KH.PC)
- Renewable Energy Consumption (% of total final energy consumption) (EG.FEC.RNEW.ZS)
- Fossil Fuel Energy Consumption (% of total) (EG.USE.COMM.FO.ZS)
Here’s how I approached this task and the key decisions made along the way.
Infrastructure Setup
Azure Data Lake Storage (ADLS):
To start, I created a resource for Azure Data Lake Storage Gen 2 for efficient data management and storage. Enabling hierarchical namespaces optimizes the storage for large-scale data analytics.
Azure Synapse Workspace:
Next, I established the Synapse workspace, specifying the resource group, storage account and file system. Synapse serves as my analytical powerhouse, integrating data storage, big data, and data exploration capabilities, allowing seamless data processing and visualization.
Extracting Data with ADF
Azure Synapse Analytics leverages Azure Data Factory’s foundation for its data integration capabilities, including pipelines and data flows. This enables efficient ETL processes.
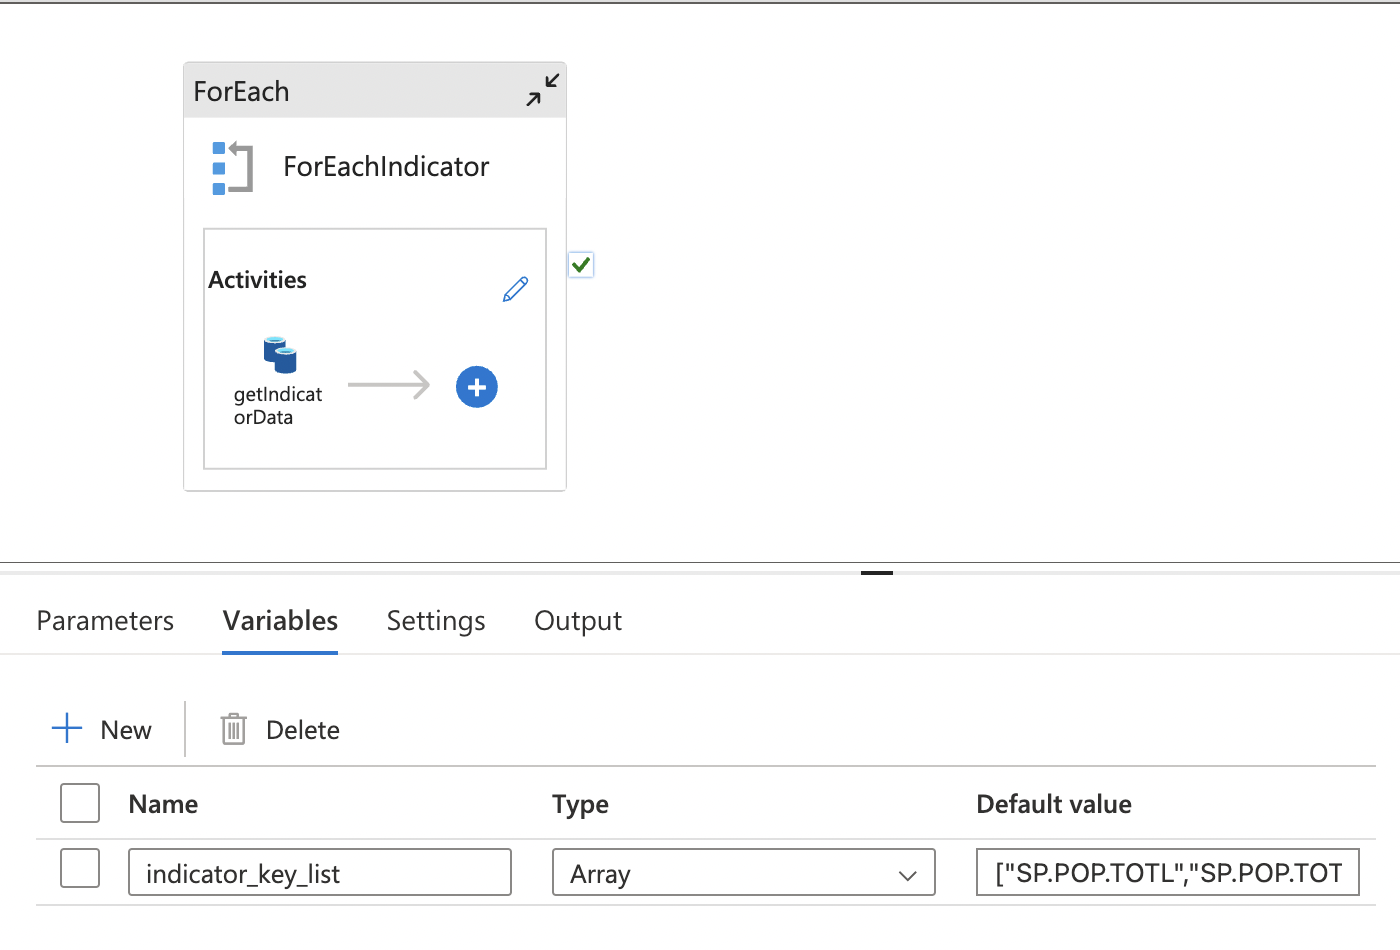
For extracting data from the World Bank API, I implemented a dynamic Copy Activity within a ForEach Loop, optimizing data extraction and transformation. Here’s an overview of the setup:
Components
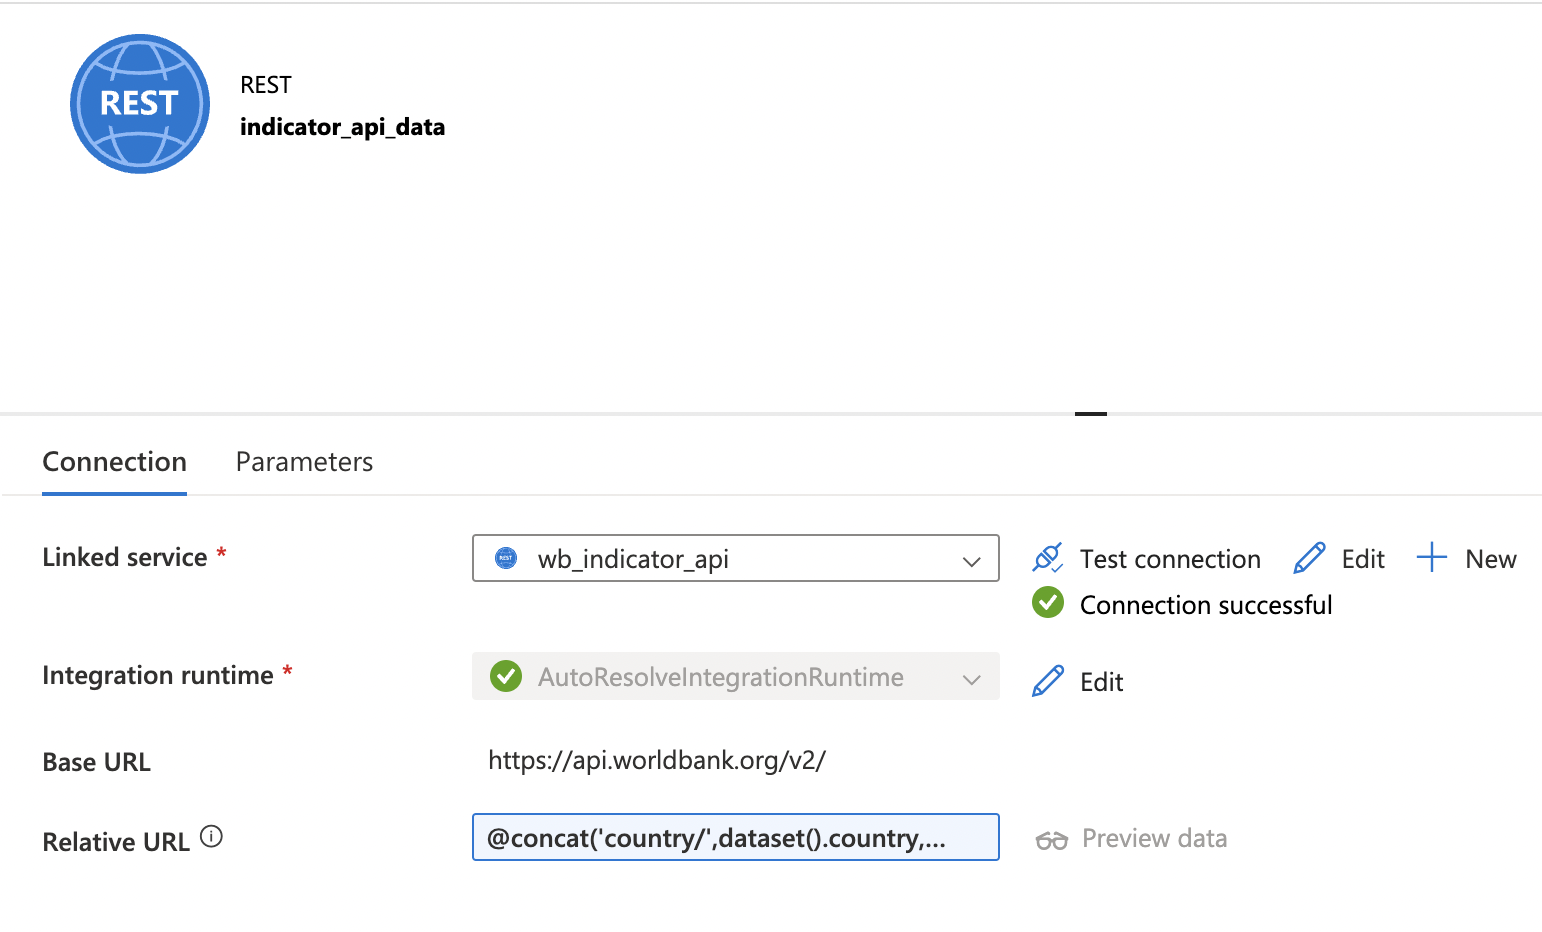
- Source Dataset: REST API
- Linked to World Bank API
- Parameterized URL for dynamic data extraction: https://api.worldbank.org/v2/country/{Country}/indicator/{Indicator}?format=json&per_page=200
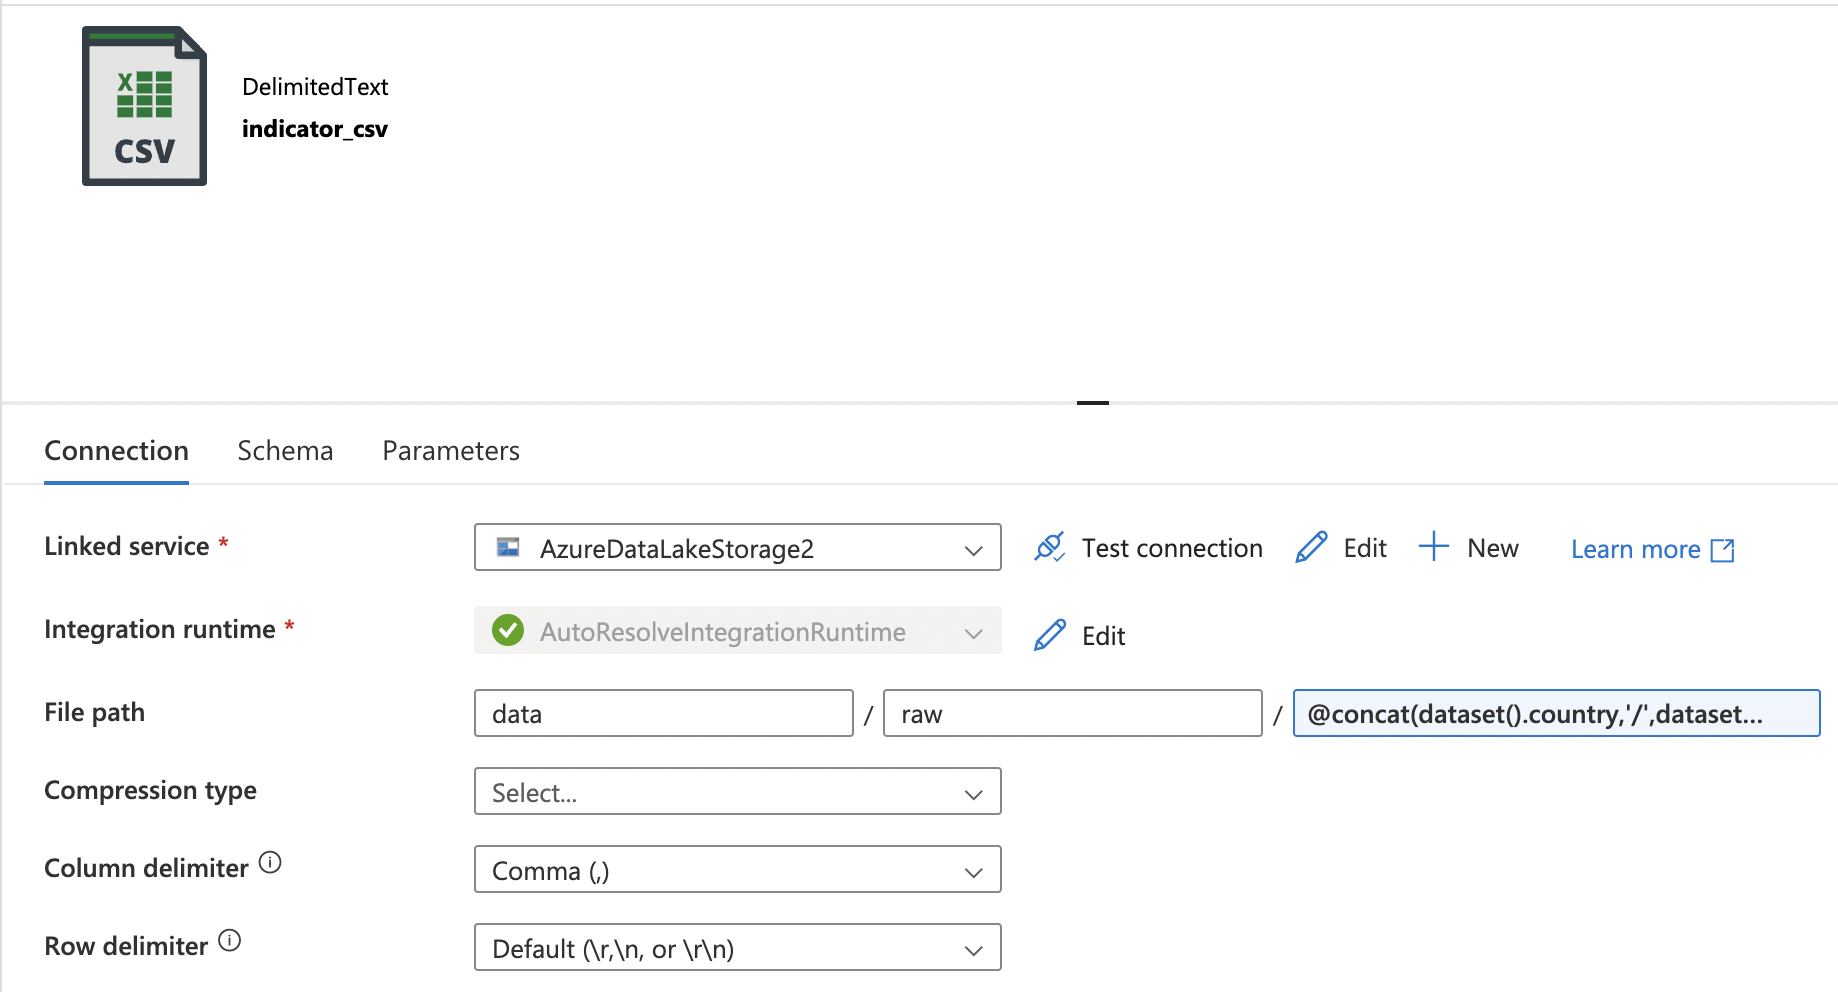
- Sink Dataset: Azure Data Lake Gen 2 CSV
- Linked to hierarchical storage account
- Dynamic file paths and names for organized storage of indicators, within country-specific folders: data/raw/{Country}/(Indicator).csv
- Mapping
- JSON to CSV conversion in Copy Activity
- Focused on essential data: dates and values
- Pipeline Parameters
- Country: Specifies the target country code for data processing
- Pipeline Variable
- Indicator: World Bank indicator code for dynamic extraction
Benefits of This Approach
-
Parallel Execution: The ForEach loop is configured for up to 50 simultaneous copy activities (by setting sequential execution to false), maximizing throughput and reducing processing time.
-
Dynamic Naming and Partitioning: Efficient data organization is achieved using dynamic content and parameters, with each iteration processing a different indicator.
-
Simplified Mapping: The Copy Activity offers straightforward column mapping, ideal for handling the complex structures of World Bank datasets.
-
Overcoming Data Flow Limitations: Copy Activity was chosen over Data Flow due to its better handling of mapping json to csv, ensuring efficient and accurate data extraction.
-
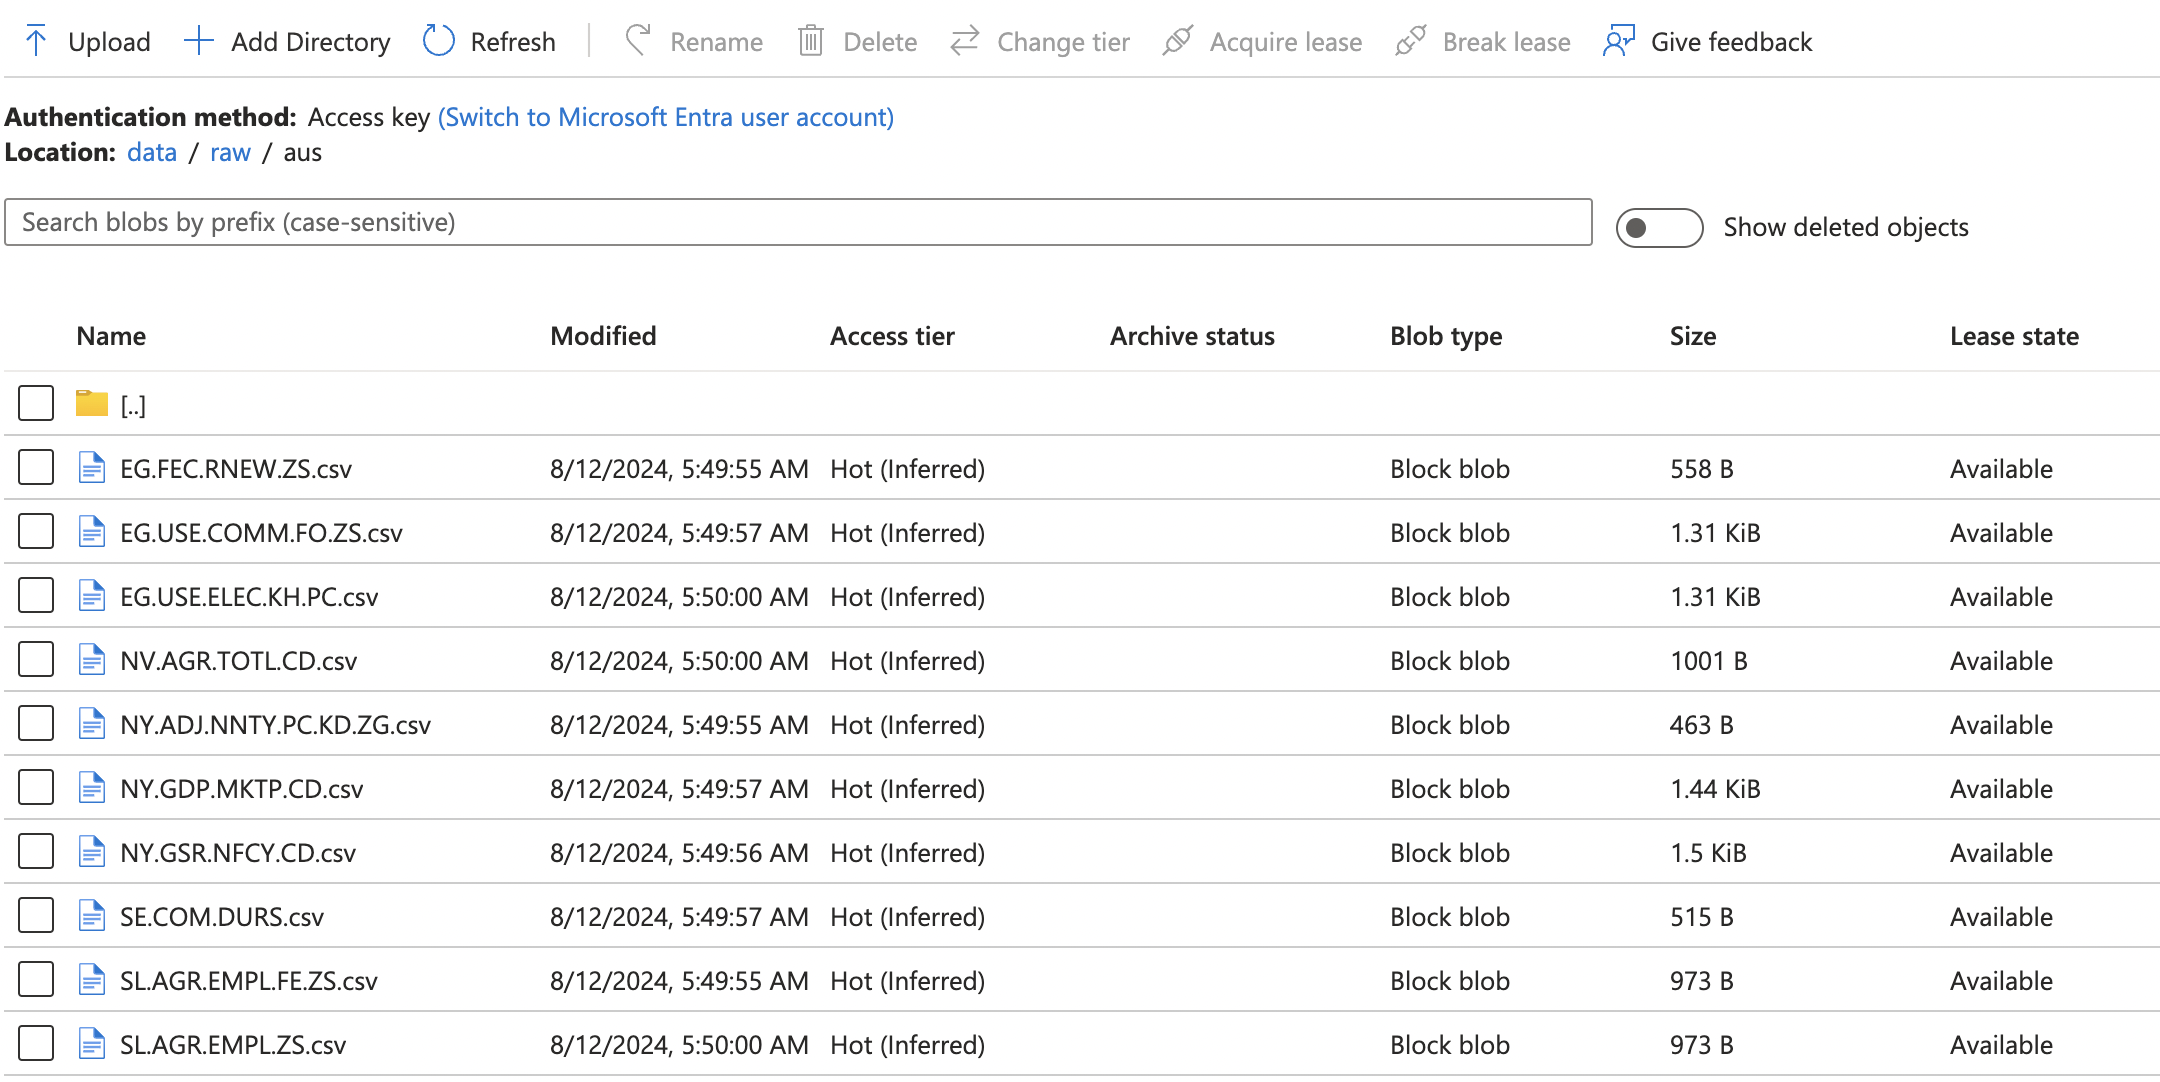
Organized Data Storage: Indicators are stored in separate files within country-specific folders, enabling easy access and flexible analysis.
Transforming Data with Synapse Serverless SQL Pool
After extracting all the datasets into the data lake, Azure Synapse’s serverless SQL pool provides an ideal solution for data transformation. This serverless architecture offers several advantages:
- On-demand compute: Resources are allocated dynamically, optimizing cost efficiency.
- Direct querying: Allows execution of SQL queries directly against files in the data lake.
- No resource provisioning: Eliminates the need for manual setup and management of compute resources.
For this project, we created two external tables to house the combined data from all indicators for Australia and the USA. The process involves several steps:
1. Creating and Using the Database
First, we create a new database with appropriate collation settings:
CREATE DATABASE wb_db
COLLATE Latin1_General_100_BIN2_UTF8;
GO;

USE wb_db;
GO;
This collation (Latin1_General_100_BIN2_UTF8) ensures proper sorting and comparison of Unicode characters, which is crucial for international data.
2. Creating an External Data Source
We then define an external data source pointing to our Azure Data Lake storage:
CREATE EXTERNAL DATA SOURCE wb_storage WITH (
    LOCATION = 'https://wbstorageact.dfs.core.windows.net/data/'
);
GO;
This step establishes the connection between our Synapse workspace and the storage account containing our World Bank data.
3. Defining the File Format
We create an external file format to specify how our CSV files should be interpreted:
CREATE EXTERNAL FILE FORMAT CsvFormat
WITH (
    FORMAT_TYPE = DELIMITEDTEXT,
    FORMAT_OPTIONS (
        FIELD_TERMINATOR = ',',
        STRING_DELIMITER = '"',
        USE_TYPE_DEFAULT = TRUE
    )
);
GO;
This format definition ensures correct parsing of our CSV files, handling field separators and string delimiters appropriately.
4. Creating External Tables
Finally, we create external tables for each country. Here’s an example for Australia:
CREATE EXTERNAL TABLE aus
WITH (
    LOCATION = 'output/aus/',
    DATA_SOURCE = wb_storage,
    FILE_FORMAT = CsvFormat
)
AS
SELECT
    a.[C1] AS [Date],
    a.[C2] AS [TotalPopulation],
    b.[C2] AS [FemalePopulation],
    c.[C2] AS [MalePopulation],
    -- ... (additional columns)
FROM (
    SELECT C1, C2
    FROM OPENROWSET(
        BULK 'raw/aus/SP.POP.TOTL.csv',
        DATA_SOURCE = 'wb_storage',
        FORMAT='CSV',
        PARSER_VERSION = '2.0',
        FIRSTROW = 2,
        FIELDTERMINATOR = ','
    ) AS a
) AS a
FULL OUTER JOIN (
    SELECT C1, C2
    FROM OPENROWSET(
        BULK 'raw/aus/SP.POP.TOTL.FE.IN.csv',
        DATA_SOURCE = 'wb_storage',
        FORMAT='CSV',
        PARSER_VERSION = '2.0',
        FIRSTROW = 2,
        FIELDTERMINATOR = ','
    ) AS b
) AS b ON a.[C1] = b.[C1]
-- ... (additional FULL OUTER JOINs for other indicators)
This complex query combines data from multiple CSV files, each representing a different World Bank indicator. Key points:
- OPENROWSET is used to read each CSV file directly.
- FULL OUTER JOIN ensures all dates are included, even if some indicators have missing data.
- Column aliases provide meaningful names for each indicator.
Data Exploration and Visualization
Once the external tables are created, they can be queried directly using Synapse’s serverless SQL pool. This allows for immediate data exploration and basic visualization using Synapse’s built-in capabilities. For example:
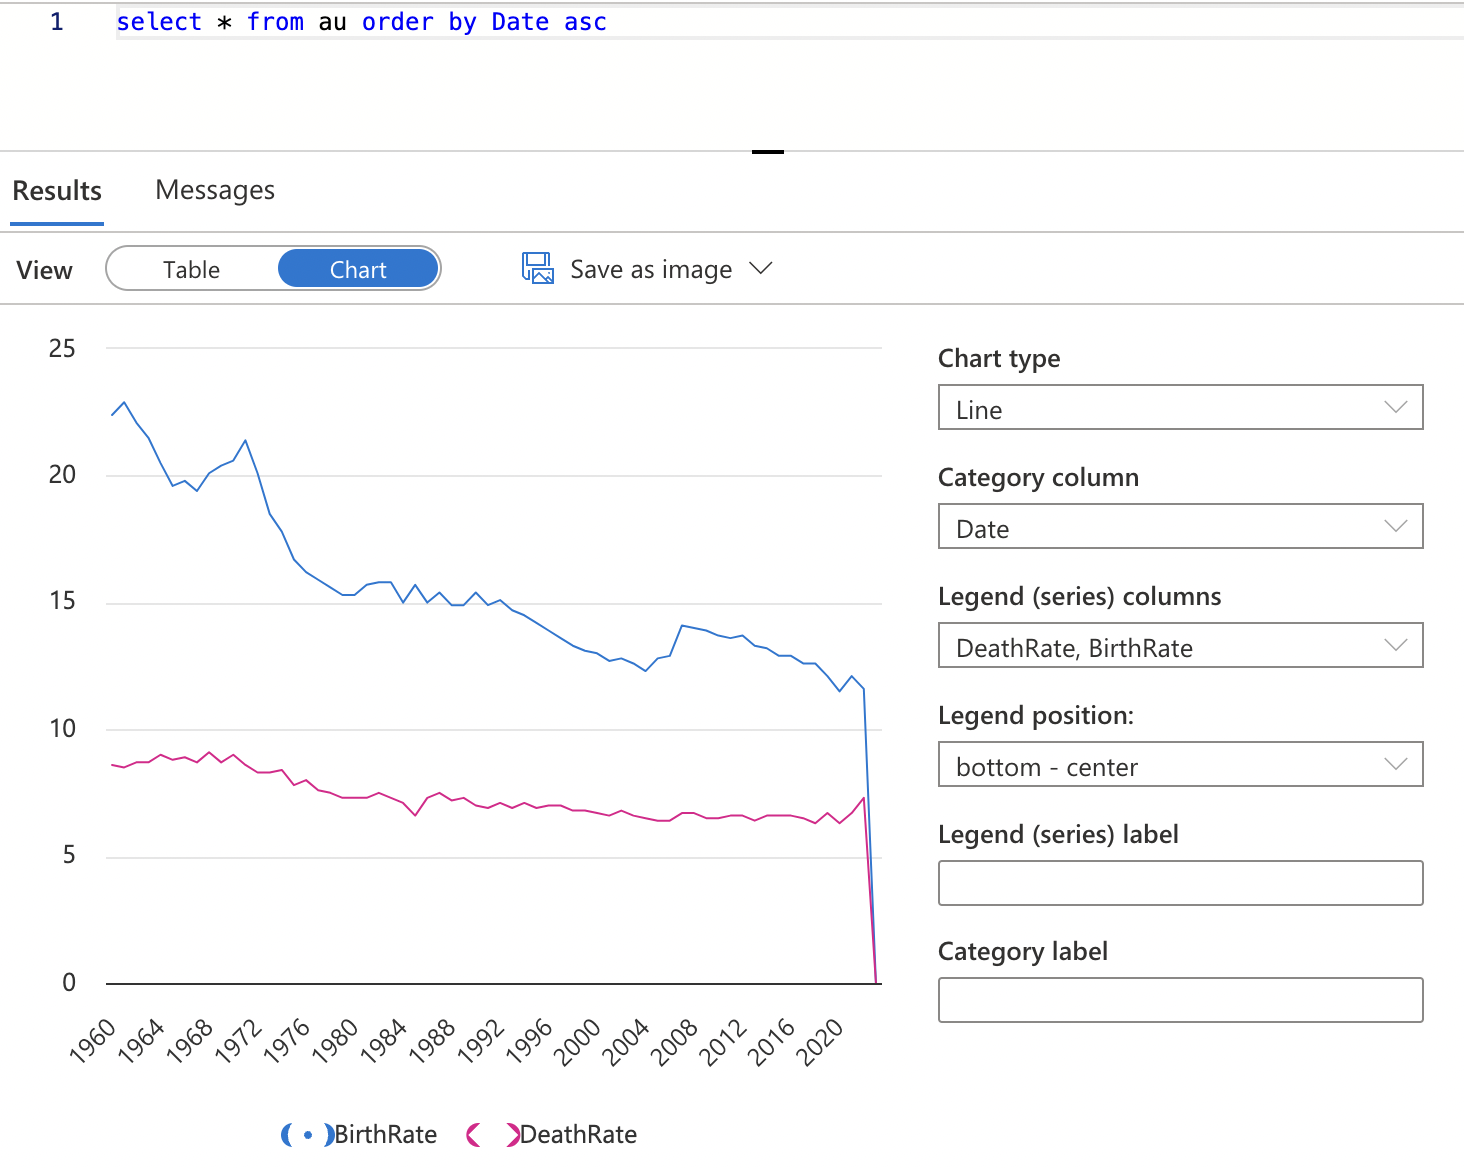
While Synapse offers some visualization options, they are somewhat limited in customization. For more advanced and tailored visualizations, a linked connection to Power BI can be established. This integration allows for:
- Real-time data refreshes
- Complex data modeling
- Interactive dashboards
- A wide range of customizable visualizations
Conclusion
This project demonstrates the power of cloud-based tools like Azure Data Factory and Azure Synapse Analytics in building a scalable and flexible data pipeline. By leveraging these tools, I have created a comprehensive dataset of World Bank indicators, empowering stakeholders with the insights needed to drive informed decisions.
Whether you’re a researcher, policymaker, or business analyst, this dataset offers a rich source of information to explore and utilize.